From raw signal
to a connected view.
Eighteen tools for the dump1090 and readsb ecosystem. An exercise in making complex, live data understandable—and building the systems that keep it useful.
Complex data.
A clearer picture.
An ADS-B receiver produces a stream of aircraft information. Making that information useful means more than displaying it: the data needs to be read, organized, visualized, monitored, and connected to other tools.
Start with a readable interface.
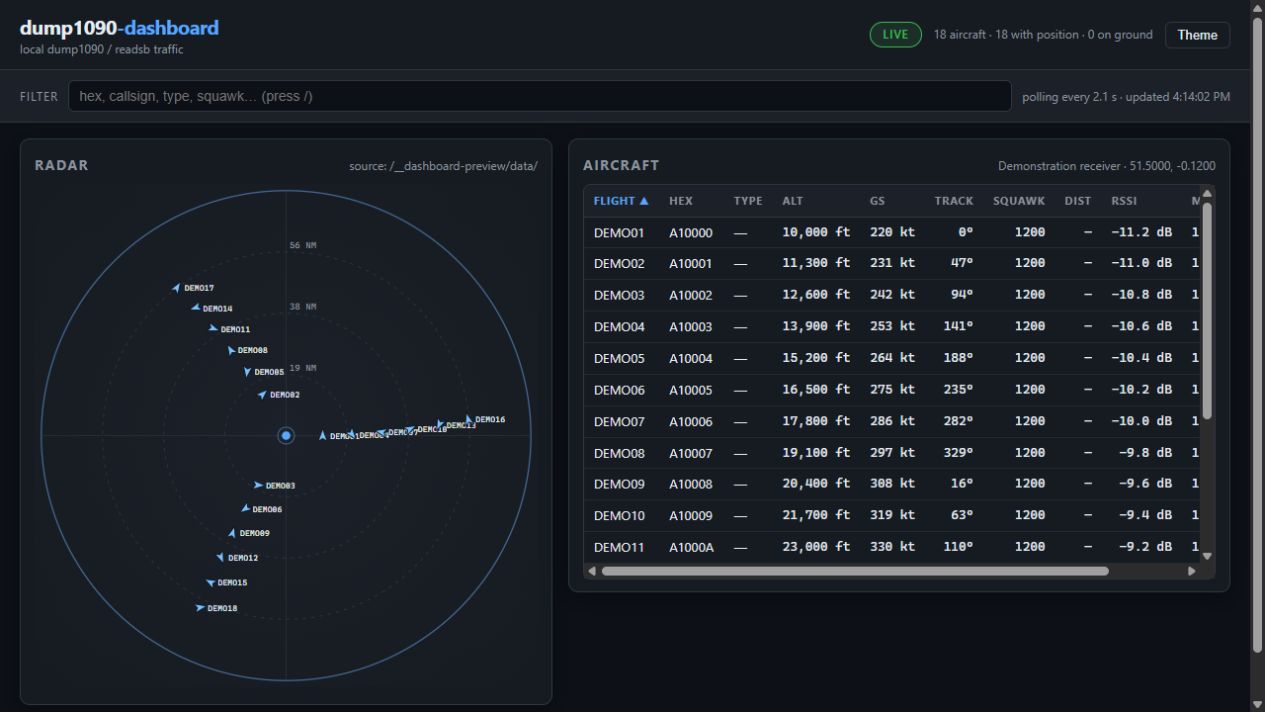
The dump1090 dashboard combines a receiver-centered radar plot with a searchable aircraft table. Live updates, a selected-aircraft view, and light and dark themes turn a raw feed into an interface that can be explored.
The image above shows the actual application, built from the public source and populated with synthetic aircraft for this demonstration.
Support the experience underneath.
The wider collection covers receiver monitoring, notifications, data export, recording, replay, and SDKs. The dump1090-stack project assembles a decoder, map, metrics, dashboards, and alerting through Docker Compose.
- Frontend visualization for aircraft position and telemetry.
- Prometheus metrics, Grafana dashboards, and alerting integrations.
- Developer tools and Python components for working with receiver data.
- Individual repositories that can be inspected and used independently.
This is TechnoThatch’s open-source engineering work, with source and documentation available publicly.
Explore the deployment stack ↗- PROJECT TYPE
- Open-source ecosystem
- SCOPE
- 18 aviation tools & add-ons
- FOCUS
- Visualization · Integration · Monitoring